On the night of March 25, national news carried dramatic scenes of police clearing an encampment of about 200 people experiencing homelessness in Echo Park, just north of downtown Los Angeles. Police arrested 182 protesters who had gathered to stop the clearing, firing nonlethal rounds into the crowd. They were able to remove all people experiencing homeless from the park in spite of the large protest, in the process arresting three journalists who were later released.
The forced removal from Echo Park nearly coincided with the release of the U.S. Department of Housing and Urban Development’s Annual Homelessness Assessment Report (AHAR): Part 1 for 2020, and seemed to evidence the changes in homelessness it documented.
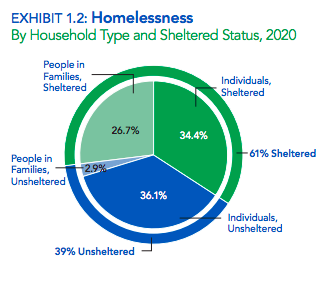
The rates of unsheltered homelessness — including people living in encampments — and chronic homelessness rose, even while other categories of homelessness declined in frequency. Those rate increases were enough to drive up the overall number of people experiencing homelessness by 2.2%, the fourth year in a row of growth.
HUD Secretary Marcia Fudge called the trends “very troubling” in a press release. But experts have noted that there are many barriers to gathering accurate information on the homeless population — and because of the methodology HUD employs to calculate that information, the most recent report may even be understating the extent of the homelessness crisis manifested by the standoff at Echo Park.
Comprehensive studies face delays
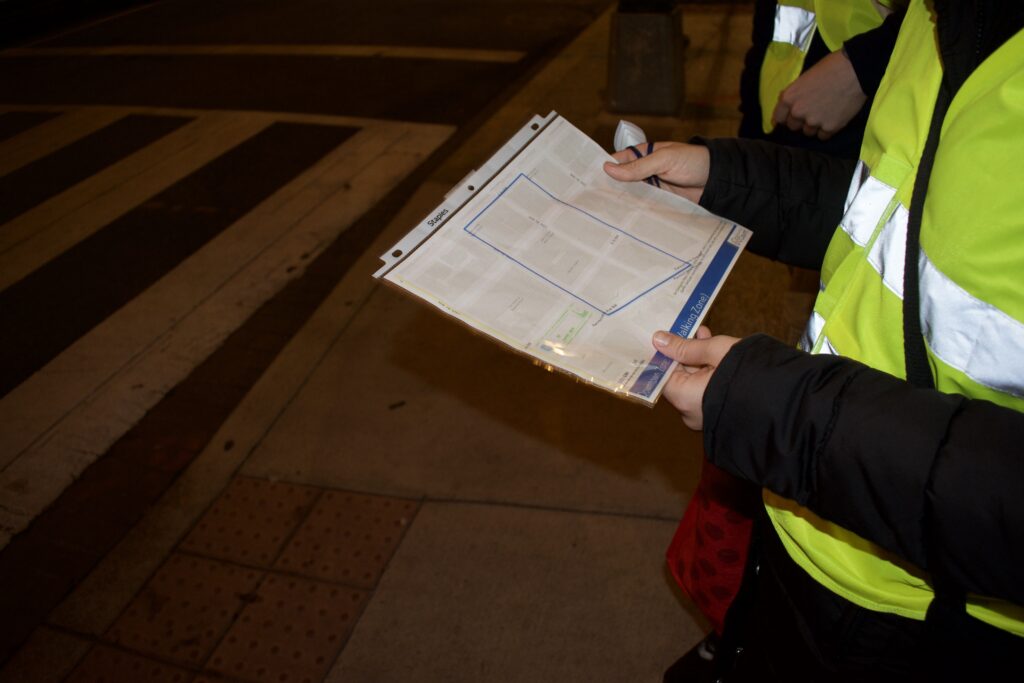
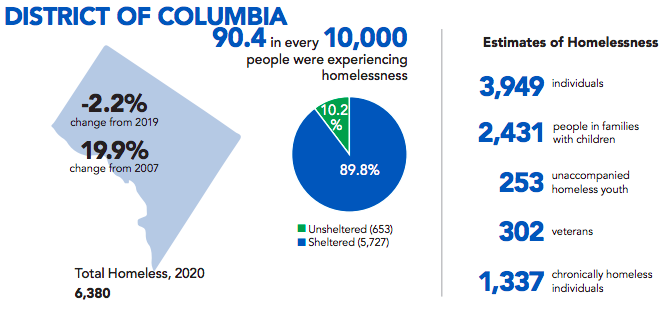
On the night of Jan. 27, 2020, volunteers in D.C. and across the country set out on an ambitious task: counting and recording every person experiencing homelessness in the U.S. that night. That annual effort — known as the Point-In-Time (PIT) Count — generates the data that forms the backbone of HUD’s AHAR: Part 1.
The information in AHAR: Part 1 in many ways defines the public perception of American homelessness. Media and advocacy groups draw on PIT Count data to form a narrative around homelessness, and Congress and HUD use the information to allocate funding to different programs and prioritize different demographic groups.
But AHAR: Part 1 is not — and is not meant to be — the final word on homelessness in the country. There is a corresponding Part 2 report that is more comprehensive, but that takes much longer to produce. As a result, the people making influential policy decisions about homelessness may in some cases be doing so without understanding the scope of the problem.
While Part 1 relies on the annual PIT Count, the follow-up report uses data from Homeless Management Information Services (HMIS) — data entry systems used by service providers to keep track of the people they serve. Part 2 presents a look at an entire year’s worth of data, not just one night’s worth.
The differences between Part 1 and Part 2 can be revealing. The 2018 PIT count found about 500,000 people experiencing homelessness on the night the count was conducted. But HMIS data from that year showed that nearly 1.5 million people used homelessness services at some point during the year — almost three times the number of people identified by Part 1.
The long delay between the two reports’ release makes AHAR: Part 2 far less influential. Before 2018, Part 1 was generally released in December or November of the same year as the PIT count, and Part 2 came out between September and December of the following year.
Since 2018, however, the reports have become even more delayed. The 2018 AHAR: Part 2 came out in September 2020. The 2019 and 2020 AHAR: Part 2 have not been released at all.
A HUD spokesperson wrote in an email to Street Sense Media it will publish the 2020 AHAR Part 2 in fall 2021 and it will include the data from 2019. HUD attributed the delay to the transition to new data collection tools and a decrease in funding because of the COVID-19 pandemic, and said they do not anticipate a similar delay in the future.
The two reports present information that is not always directly comparable. The fundamental difference is that Part 1 attempts to count all people experiencing homelessness, while Part 2 only draws on HMIS data for people who utilized shelters that collaborate with HUD.
Among sheltered people, though, Part 2 provides information that is beyond the scope of Part 1, including statistics on how many people were people with disabilities or survivors of domestic violence. Both reports offer statistics on age, sex and race/ethnicity.
Most importantly, Part 2’s “Broader Perspectives on Housing Instability and Homelessness” section compiles information on people who may not meet HUD’s standard definition of homelessness (living in a shelter or in a place not fit for human habitation) but who are still housing-insecure. Sources include the Census Bureau’s American Community Survey, the U.S. Department of Education, and even other reports by HUD.
The data in that section suggests that the scale of the country’s affordable housing crisis is much greater than what the PIT Count can quantify. For instance, in a section summarizing HUD’s 2019 Worst Case Housing Needs report, AHAR: Part 2 stated that 7.7 million families in 2017 had “worst-case needs.” Worst-case needs are defined as renters making less than 50%of the Area Median Income without housing assistance and living in “severely inadequate housing,” renters paying more than half of their income in rent, or those doing both.
“Almost all households with worst-case needs (98%) pay more than half their income for rent,” the report reads, “an untenable situation that puts people at risk of homelessness.”
The Education Department collects data from state educational agencies on how many students between 3rd and 12th grades are either staying in shelters, navigating transitional housing, or waiting for foster care placement; living unsheltered; residing in a hotel or motel because they had nowhere else to go; or sharing someone else’s house as a result of lost housing — a condition called “doubling up.”
About 1.5 million students fit at least one of those criteria at some point during the 2017-2018 school year, the Education Department found. By contrast, the 2018 PIT count found just 110,000 people under the age of 18 experiencing homelessness — sheltered as well as unsheltered — on the night it was conducted.
“Modest at best, a severe undercount at worst”
According to some experts, the crucial question is not which part of AHAR is better, but whether AHAR is a successful way to measure homelessness at all.
“Counting homeless people is almost impossible,” said Donald Whitehead, executive director of the National Coalition for the Homeless. He argues that it is important that the national understanding of homelessness not be limited to data from just one count.
People who are doubled up, for instance, are not present at all in AHAR: Part 1. “Those are numbers that should be in any report,” Whitehead said. The report also misses people experiencing homelessness who, on the night of the PIT count, happen to be in jails, hospitals, or dangerous living areas where the volunteer counters don’t want to go.
[Read more: Seeing Double: DC drastically reduces the number of people in shelter as more double up]
But even the AHAR: Part 2 figures suggesting a larger homelessness crisis are “modest at best, a severe undercount at worst,” Whitehead said.
The issue is that service providers want to demonstrate a decline in homelessness in the areas for which they’re responsible, creating an incentive to undercount. But the cumulative effect of this kind of incentive, Whitehead said, is that homeless services don’t get the full funding they need.
“We start at a deficit because we don’t have the right numbers to give to Congress to get resources,” he said.
A HUD spokesperson wrote in an email that, “While the PIT count is not perfect it provides unique insights about people experiencing sheltered and unsheltered homelessness and gives us a sense of trends in homelessness over time.”
“HUD urges communities to continually improve how they conduct data collection to bring greater confidence to the data. However, HUD is confident in the data reported in the AHAR and recommends that communities use that data to help them improve how they serve people experiencing homelessness.”
But Barbara Duffield, executive director of the national advocacy nonprofit SchoolHouse Connection, agreed with Whitehead. She called HUD’s effort a “very dramatic” undercount, saying the PIT Count does not represent homelessness but rather how well the count was conducted.
According to Duffield, policy leaders should give more weight to the data the Department of Education collects on homelessness among schoolchildren because the methodology is more trustworthy than either the PIT count or the HMIS data. School systems are required by the Education Department to seek out homeless children, whereas service providers only count people who come to them and can be limited by their own capacity. Schools are located everywhere, unlike service providers. And schools are not punished or rewarded for what they find.
[Read more: There was an 800-person discrepancy between two counts of youth homelessness completed four months apart in DC]
Duffield also criticized HUD’s definition of homelessness as too narrow. HUD does not prioritize children and families as much as it should, Duffield said, because they are more likely to be unofficially homeless — doubled up or staying in a motel — relative to other people experiencing homeless. Children and families are thus less represented in the PIT Count.
“People are giving HUD numbers way more credibility than they should,” Duffield said.
HUD has edited its definition of who counts as homeless over the years. In 2012, it expanded the definition to include “families with children or unaccompanied youth who are unstably housed and likely to continue in that state.” At the time, the Urban Institute predicted the expansion would not have much effect since no new programs or funds came with the change in wording.
In the same update, HUD acknowledged that it “limit[ed] the eligibility of individuals and families living in unsanitary and unsafe living conditions.” But it countered that other programs exist to help people who are “at-risk” of homelessness, such as the Housing Choice Voucher Program and public housing. Both of those programs have been disinvested from over the years
In 2016, HUD again acknowledged narrowing its definition of “chronic homelessness” for the purpose of targeting limited resources.
Duffield wants the data collected by the Education Department to play a more important role in forming a “composite” picture of homelessness in conjunction with HUD’s data. She said that ultimately the homeless services system as a whole pays the price for inaccurate counting.
As it is now, Duffield said, the current protocol “keeps faulty systems and faulty programs funded.”